-
Project Management: All You Need to Know
$99.00Upon completion of this course you will have developed valuable new skills that will allow you to competently manage a project. You will come away from this course knowing about project management basics and how to being project planning. You will learn about the project life cycle and project planning documents. You’ll learn about communications and how to deal changes and project tracking and also how to conduct status meetings. The course wraps up with a look at closing your project. -
Communication Strategies
$139.99This course will teach you all about the various aspects of communication. You’ll learn about asking questions, probing for information, active listening, and body language. Supporting skills are also covered, such as self-esteem, building relationships with others, and assertiveness. -
Performance Management: Managing Employee Performance
$99.00In this course, you will learn about the Shared Management Model, which helps the manager transfer motivation and responsibility for results to the employee. This course will cover all three phases of the model: preparing the employee for the job, motivating them to do it, and evaluating their performance. -
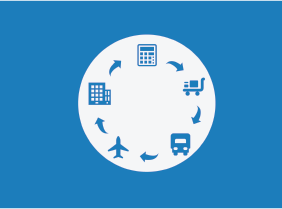
Logistics and Supply Chain Management
$99.00In this course you will learn about supply chains and logistics, various integration models, supply chain flows, who is who in a supply chain, as well as drivers and ways to optimize them. You will also gain an insight on other crucial points such as aligning your business and supply chain strategies, how to get the most out of your data, how to troubleshoot any problems that crop up and ways to develop your supply chain. -
Cannabis and the Workplace
$99.00In this course, you are going to learn about cannabis, its effects on the individual, and the potential impact in the workplace. You will consider medical cannabis, the rights and obligations of employees and employers, and the intervention process as you deal proactively by having a comprehensive drug and alcohol policy. -
Intermediate Project Management
$99.00In this course, you will focus on the last three stages of the project life cycle: planning, execution, and termination. This includes identifying tasks and resources; using scheduling techniques like the work breakdown structure, Gantt charts, and network diagrams; preparing a budget; executing a project; and controlling changes.